Where ERA5-Land Misses Urban Heat
A UK-wide, observation-led evaluation of air temperature and dew point biases—and what those biases mean for heat exposure, mortality risk and building energy analysis.
Research demo only. This page highlights the study's central evidence. Read the full article below for the complete data processing, statistical methods, assumptions, uncertainty and limitations.
Evaluation framework
From observations to consequences
The study goes beyond error statistics by tracing reanalysis bias through multiple urban-climate applications.
Observe
Quality-controlled hourly air temperature and dew point records from the Met Office MIDAS network.
Match
Elevation-adjusted ERA5-Land time series aligned with observations at the nearest grid cells.
Stratify
Station environments characterized using local and grid-scale impervious surface area.
Propagate
Biases evaluated across heat exposure, mortality-risk and building-energy case studies.
Observation record
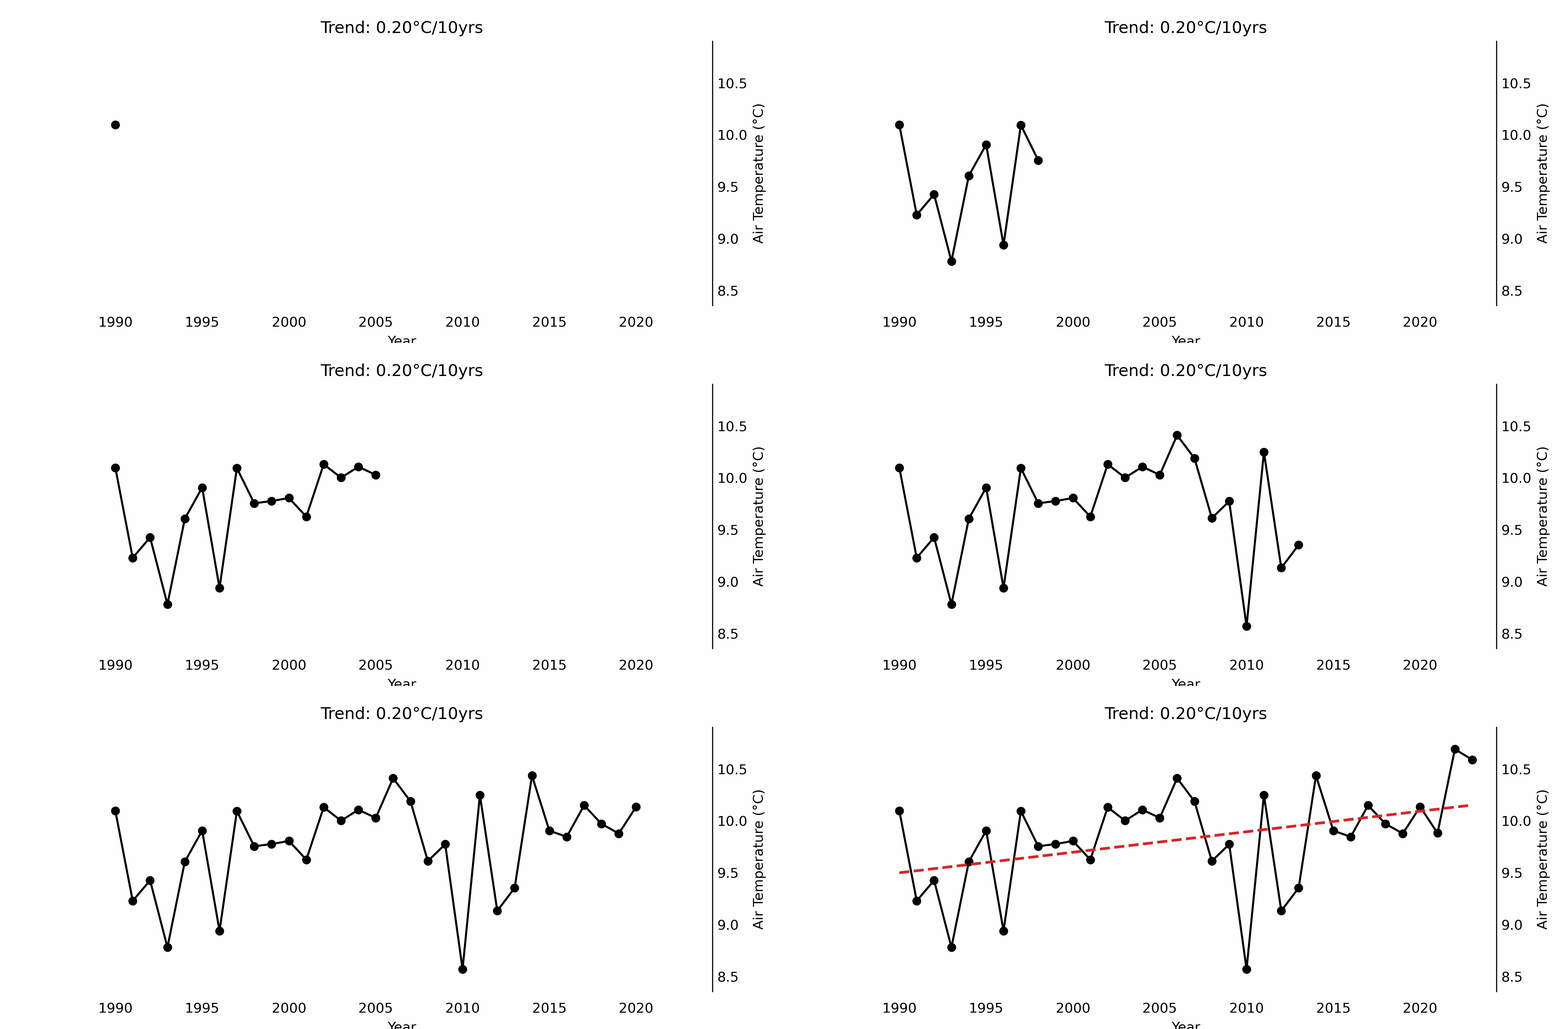
A warming signal, station by station
The animated MIDAS record shows the evolution of annual mean air temperature across the selected long-term UK stations. The aggregated observational trend is 0.20°C per decade.
Core evidence
Useful reanalysis—with an urban blind spot
ERA5-Land captures broad patterns, but smooths temperature variability and increasingly underestimates warmth as the surrounding built fraction rises.
Observation scale
Hourly records from 64 long-term stations support the temporal evaluation.
Daily maximum
ERA5-Land underestimates daily maximum air temperature.
Daily minimum
ERA5-Land overestimates daily minimum air temperature.
Urban sensitivity
Indicative ISA transition range above which the cold bias becomes more pronounced.
Compressed temperature range
Maximums are too cool while minimums are too warm: the amplitude of observed temperature is damped.
Built-up environments matter
Local impervious cover and insufficient representation of urban surfaces within the ERA5-Land grid jointly shape the underestimation.
Bias propagation
Small climate biases can change decisions
Too few extreme-heat hours
Annual extreme-heat exposure is underestimated in both urban and rural areas.
>10% heat-mortality bias
The Greater London case study can underestimate heat-attributable deaths by more than 10%.
Demand shifts
Cooling demand is underestimated by 2.90–3.14%, while heating demand is overestimated by 3.11–3.38%.
Full research article
Read beyond the demo
Complete methods, evaluation, impact case studies and limitations.